HTML Bar Chart with Dynamic Scaling: Power BI Template
Create responsive HTML-based bar charts in Power BI with automatic scaling, prior year markers, and variance indicators. Perfect for regional sales dashboards.
This template creates a professional HTML-based bar chart visual in Power BI using DAX. Unlike SVG visuals, this approach uses HTML and CSS to create responsive, styled bar charts perfect for comparing regional sales performance across years with dynamic scaling and variance indicators.
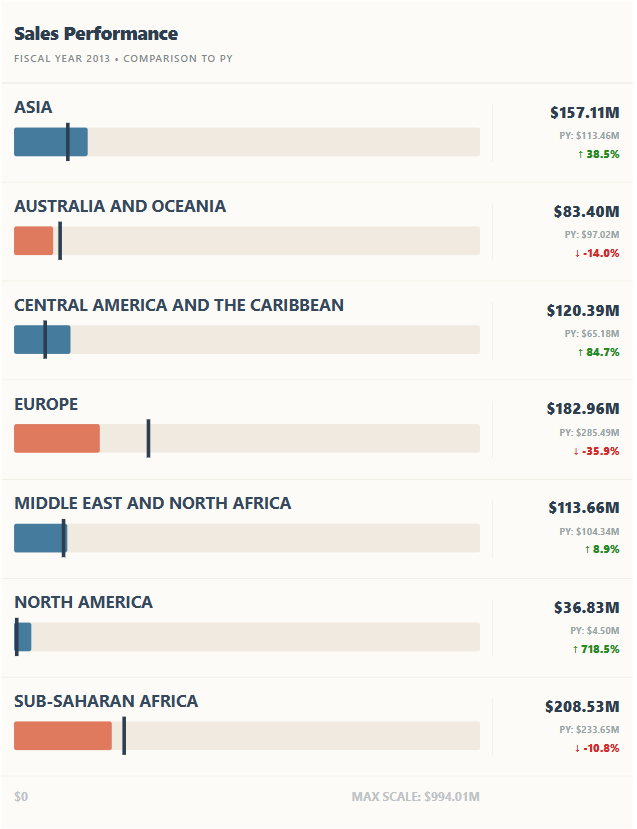
Example output showing regional sales comparison with prior year markers
What This Visual Does
- Responsive Bar Charts: HTML-based bars that scale dynamically based on data
- Prior Year Markers: Vertical lines showing previous year values for quick comparison
- Variance Indicators: Shows percentage change with up/down arrows
- Smart Number Formatting: Automatic K/M/B suffixes for better readability
- Multi-Region Support: Displays all selected regions with consistent scaling
- Clean Header/Footer: Professional styling with context and scale indicators
Complete DAX Code
Combine the blocks in order into one measure. The output contains HTML with embedded SVG, so it requires an HTML-rendering custom visual; a native Power BI table does not render arbitrary HTML. Review your organisation's custom-visual policy before installing one.
Choose the right comparison context
Start with one row per region in the rendering dataset and a single selected year. The example relies on SELECTEDVALUE for both values, so multiple years or a total row without one region can produce a blank selection and misleading results. Turn off totals for the first test and use a single-select year slicer.
The Order Date year hierarchy in this example represents calendar years. The displayed wording should say calendar year unless you replace the logic with your organisation's fiscal calendar. A year-to-date view also needs equivalent prior-year dates; a full previous year is not a fair comparison with an unfinished current year.
Note that FILTER(ALL('Sales')) clears filters from the fact table in the prior-year calculation. That can remove product or customer selections you intended to keep. Before deployment, adapt the calculation to remove only the relevant date filters in your calendar model, then test every slicer against a plain revenue table.
  HTMLBar_DynamicScaling =
  -- 1. Context & Revenue
  VAR SelectedYear = SELECTEDVALUE('Sales'[Order Date].[Year])
  VAR CurrentRegion = SELECTEDVALUE('Sales'[Region])
  VAR Revenue = SUM('Sales'[Total Revenue])
  VAR YearIsFiltered = ISFILTERED('Sales'[Order Date].[Year])

  -- 2. Prior Year Calculation
  VAR RevenuePY =
      IF(NOT(YearIsFiltered),
          BLANK(),
          CALCULATE(
              SUM('Sales'[Total Revenue]),
              FILTER(
                  ALL('Sales'),
                  'Sales'[Region] = CurrentRegion &&
                  'Sales'[Order Date].[Year] = SelectedYear - 1
              )
          )
      )
Step 2: Global Scale Calculation
  -- 3. GLOBAL SCALE
  VAR AllRegionsInView = ALLSELECTED('Sales'[Region])
  VAR MaxCurrentVisible = MAXX(AllRegionsInView, CALCULATE(SUM('Sales'[Total Revenue])))
  VAR MaxValueForScale =
      IF(YearIsFiltered,
          MAX(MaxCurrentVisible, MAXX(AllRegionsInView, CALCULATE(SUM('Sales'[Total Revenue]), FILTER(ALL('Sales'), 'Sales'[Order Date].[Year] = SelectedYear - 1)))),
          MaxCurrentVisible
      )
  VAR GlobalMax = MaxValueForScale * 1.1

  -- 4. LOCAL FORMATTING
  VAR Val = ABS(Revenue)
  VAR Sfx = IF(Val >= 1e9, "B", IF(Val >= 1e6, "M", IF(Val >= 1e3, "K", "")))
  VAR Dvsr = IF(Val >= 1e9, 1e9, IF(Val >= 1e6, 1e6, IF(Val >= 1e3, 1e3, 1)))

  -- 5. SVG Internal Coordinates
  VAR V_Width = 400
  VAR V_Height = 65
  VAR BarMaxVWidth = 390
  VAR BarWidth = DIVIDE(Revenue, GlobalMax) * BarMaxVWidth
  VAR PYMarkerPos = DIVIDE(RevenuePY, GlobalMax) * BarMaxVWidth
Step 3: Variance & Styling
  -- 6. Variance & Styling
  VAR VarPct = DIVIDE(Revenue - RevenuePY, RevenuePY)
  VAR VarColor = IF(VarPct >= 0, "#228B22", "#D22B2B")
  VAR BarColor = IF(YearIsFiltered && VarPct < 0, "#E07A5F", "#457B9D")
Step 4: HTML Components
  -- 7. HTML COMPONENTS (Hierarchy & Consistency)
  VAR HeaderHTML =
      "<div style='font-family:Segoe UI, Arial; padding: 20px 15px; background-color:#FDFBF7; border-bottom:2px solid #EEE;'> " &
          "<div style='font-size:22px; font-weight:900; color:#2C3E50; letter-spacing:-0.5px;'>Sales Performance</div>" &
          "<div style='font-size:12px; font-weight:600; color:#7F8C8D; text-transform: uppercase; letter-spacing:1px; margin-top:4px;'>" &
              IF(YearIsFiltered, "Fiscal Year " & SelectedYear & " • Comparison to PY", "Historical Aggregate Analysis") &
          "</div>" &
      "</div>"

  VAR ResponsiveRow =
      "<div style='display: flex; align-items: center; background-color:#FDFBF7; padding: 12px 15px; border-bottom: 1px solid #F0EAE0;'>" &

          -- COLUMN 1: Visual Chart Area
          "<div style='flex: 1;'>" &
              "<svg viewBox='0 0 " & V_Width & " " & V_Height & "' width='100%' preserveAspectRatio='xMinYMid meet' style='display:block;'>" &
                  -- REGION LABEL (Hierarchy Level 2)
                  "<text x='0' y='16' font-family='Segoe UI, Semibold' font-size='14' font-weight='700' fill='#34495E'>" & UPPER(CurrentRegion) & "</text>" &

                  -- BAR
                  "<rect x='0' y='28' width='" & BarMaxVWidth & "' height='24' fill='#F0EAE0' rx='2' />" & -- Background Track
                  "<rect x='0' y='28' width='" & BarWidth & "' height='24' rx='2' fill='" & BarColor & "' />" &

                  -- PY MARKER
                  IF(YearIsFiltered && NOT(ISBLANK(RevenuePY)),
                      "<rect x='" & (PYMarkerPos - 1) & "' y='24' width='3' height='32' fill='#2C3E50' />",
                      ""
                  ) &
              "</svg>" &
          "</div>" &

          -- COLUMN 2: Performance Metrics (Hierarchy Level 3)
          "<div style='flex: 0 0 150px; font-family: Segoe UI; text-align: right; border-left: 1px solid #EEE; padding-left: 20px;'>" &
              -- Primary Metric
              "<div style='font-size:18px; font-weight:800; color:#2C3E50; line-height:1;'>" &
                  "quot; & FORMAT(DIVIDE(Revenue, Dvsr), "#,0.00") & Sfx &
              "</div>" &

              -- Secondary Details (only shown when filtered)
              IF(YearIsFiltered && NOT(ISBLANK(RevenuePY)),
                  "<div style='margin-top:6px;'>" &
                      "<span style='font-size:11px; font-weight:700; color:#95A5A6; vertical-align:middle;'>PY: quot; & FORMAT(DIVIDE(RevenuePY, Dvsr), "#,0.00") & Sfx & "</span>" &
                      "<div style='font-size:13px; font-weight:800; color:" & VarColor & "; margin-top:2px;'>" &
                          IF(VarPct >= 0, "↑ ", "↓ ") & FORMAT(VarPct, "0.0%") &
                      "</div>" &
                  "</div>",
                  ""
              ) &
          "</div>" &
      "</div>"

  -- X-AXIS (Hierarchy Level 4)
  VAR AX_Val = ABS(GlobalMax)
  VAR AX_Sfx = IF(AX_Val >= 1e9, "B", IF(AX_Val >= 1e6, "M", IF(AX_Val >= 1e3, "K", "")))
  VAR AX_Dvsr = IF(AX_Val >= 1e9, 1e9, IF(AX_Val >= 1e6, 1e6, IF(AX_Val >= 1e3, 1e3, 1)))

  VAR XAxisHTML =
      "<div style='display: flex; background-color:#FDFBF7; padding: 8px 15px 20px 15px;'>" &
          "<div style='flex: 1;'>" &
              "<svg viewBox='0 0 " & V_Width & " 20' width='100%' preserveAspectRatio='xMinYMid meet'>" &
                  "<text x='0' y='15' font-size='10' font-weight='700' fill='#BDC3C7' font-family='Segoe UI'>$0</text>" &
                  "<text x='" & BarMaxVWidth & "' y='15' font-size='10' font-weight='700' fill='#BDC3C7' font-family='Segoe UI' text-anchor='end'>MAX SCALE: quot; &
                      FORMAT(DIVIDE(GlobalMax, AX_Dvsr), "#,0.00") & AX_Sfx & "</text>" &
              "</svg>" &
          "</div>" &
          "<div style='flex: 0 0 150px; padding-left: 20px;'></div>" &
      "</div>"

  RETURN
  IF(ISBLANK(Revenue), BLANK(),
      VAR FirstRegion = MINX(AllRegionsInView, 'Sales'[Region])
      VAR LastRegion = MAXX(AllRegionsInView, 'Sales'[Region])
      RETURN
      SWITCH(TRUE(),
          CurrentRegion = FirstRegion && CurrentRegion = LastRegion, HeaderHTML & ResponsiveRow & XAxisHTML,
          CurrentRegion = FirstRegion, HeaderHTML & ResponsiveRow,
          CurrentRegion = LastRegion, ResponsiveRow & XAxisHTML,
          ResponsiveRow
      )
  )
How to Customize This Template
1\. Change Field Names
Replace these references with your actual field names:
  -- Change these:
  'Sales'[Order Date].[Year]  → Your Date field
  'Sales'[Region]             → Your Region/Category field
  'Sales'[Total Revenue]      → Your Revenue/Measure field
2\. Adjust Visual Dimensions
Modify these variables to change the chart size:
  VAR V_Width = 400       -- SVG viewBox width
  VAR V_Height = 65       -- SVG viewBox height
  VAR BarMaxVWidth = 390  -- Maximum bar width
  VAR ScaleBuffer = 1.1   -- 10% buffer above max value
3\. Change Colors
Modify these color values to match your branding:
  VAR VarColor = IF(VarPct >= 0, "#228B22", "#D22B2B")  -- Green/Red for variance
  VAR BarColor = IF(YearIsFiltered && VarPct < 0, "#E07A5F", "#457B9D")  -- Coral decline, Blue normal
4\. Modify Header Text
Update the title and subtitle in the HeaderHTML variable:
  "<div style='font-size:22px; font-weight:900;'>Your Title Here</div>" &
  "<div style='font-size:12px;'>Your Subtitle Here</div>"
How to Add to Your Report
- Create the Measure: Right-click on a table in your model → New Measure → Paste the code
- Insert Visual: Add an approved HTML-rendering custom visual, such as HTML Content, rather than a native Table or Matrix.
- Add Region Field: Include Region so the visual evaluates one row per region; field-well names depend on the custom visual.
- Add Measure: Add the HTML measure to the rendering field and check a single region first.
- Check rendering: Confirm that the chosen visual supports the embedded SVG and styles. There is no native table setting that turns arbitrary HTML into rendered content.
- Add Year Slicer: Add a slicer for the Year field to enable filtering
How It Works
This visual uses DAX to generate HTML and SVG content dynamically:
- Context Detection: Detects selected year and current region context
- Global Scaling: Calculates max value across all visible regions for consistent scale
- Prior Year Lookup: Retrieves prior year revenue for comparison markers
- HTML Assembly: Builds responsive HTML structure with embedded SVG
- Smart Rendering: Shows header/footer only on first/last items for clean multi-region display
Key Features Explained
Global Scale System
The visual calculates the maximum value across ALL selected regions and years, ensuring all bars scale consistently:
  VAR MaxValueForScale =
      MAX(MaxCurrentVisible, MAXX(AllRegionsInView,
          CALCULATE(SUM('Sales'[Total Revenue]),
          FILTER(ALL('Sales'), 'Sales'[Order Date].[Year] = SelectedYear - 1))))
Smart Multi-Item Display
The SWITCH statement shows header only on first region and footer only on last region:
  SWITCH(TRUE(),
      CurrentRegion = FirstRegion && CurrentRegion = LastRegion,
          HeaderHTML & ResponsiveRow & XAxisHTML,  -- Single region
      CurrentRegion = FirstRegion,
          HeaderHTML & ResponsiveRow,              -- First of many
      CurrentRegion = LastRegion,
          ResponsiveRow & XAxisHTML,               -- Last of many
      ResponsiveRow                                -- Middle regions
  )
Prior Year Marker
A vertical dark line shows where the prior year value was:
  VAR PYMarkerPos = DIVIDE(RevenuePY, GlobalMax) * BarMaxVWidth
  ...
  IF(YearIsFiltered && NOT(ISBLANK(RevenuePY)),
      "<rect x='" & (PYMarkerPos - 1) & "' y='24' width='3' height='32' fill='#2C3E50' />",
      ""
  )
Troubleshooting
| Problem | Solution |
|---|---|
| Visual shows HTML code as text | Use an approved HTML-rendering custom visual, not a native table or card. |
| Prior year not showing | Check that a Year is selected in a slicer. The visual requires ISFILTERED to show prior year data. |
| Bars look too small | Increase the visual size on canvas or adjust V\_Width variable |
| Scale seems incorrect | Check that all regions have data. The scale is based on MAX across all selected regions. |
Best Practices
A worked scale example
Suppose North has current revenue of $120,000 and prior revenue of $100,000, while South has $80,000 current and $150,000 prior. The shared maximum across both periods is $150,000; with 10% headroom the scale is $165,000. On a 390-unit track, North's current bar is about 284 units wide and its prior marker is about 236 units from the origin.
North's growth is 20%; South's is approximately −46.7%. Both must use the same scale, otherwise two individually stretched bars would wrongly suggest similar revenue. Reconcile these outputs in a standard table before assessing the design.
The sample is intended for non-negative revenue. Refund-heavy periods or negative net revenue require a diverging scale around zero; a negative SVG rectangle width is not a valid solution. When every value is zero, show a no-data or zero-activity state instead of relying on a zero denominator.
Presentation and safety checks
Region names are inserted into markup. Escape characters such as ampersands and angle brackets before rendering labels from user-controlled data. Use a renderer with appropriate sanitisation; do not assume generated HTML is safe just because it came from a DAX measure.
The header and footer logic uses alphabetical first and last regions. Keep display order consistent with that rule or revise the assembly, otherwise sorting by revenue can place the header in the middle. Very long labels also need wrapping or extra row height, not smaller text everywhere.
The metric column has a fixed 150-pixel allocation, so a responsive outer container does not guarantee readability on a phone. Test narrow layouts, PDF export and service viewing separately; if they fail, offer a native bar chart and exact-value table as the fallback.
For a pure image-based alternative, see the SVG revenue variance template. For interactive marks and selections, see the Deneb custom-visual guide, or request a tailored Power BI visual.
- Use Year Slicer: Always add a year slicer to enable the prior year comparison features
- Limit Regions: For best performance, limit to 10-15 regions at a time
- Consistent Formatting: Apply the same color scheme across all custom visuals in your report
- Mobile Layout: HTML visuals work well on mobile - test responsive behavior
- Combine with Tables: Pair with a data table for users who need exact values
Next Steps
Now that you have this template working:
- Add conditional formatting for different thresholds (e.g., highlight regions below target)
- Create bookmarks for different year comparisons
- Add tooltips with additional metrics like YoY growth %
- Experiment with different bar colors based on performance tiers
This template showcases how HTML/CSS can be combined with DAX calculations to create rich, interactive visuals that go beyond standard Power BI charts.