How to Create a World Population Map in Vega
Build an engraved-style world population report with a Natural Earth map, proportional country bubbles, growth-rate hatching, a ranked table and annotations. Download the complete Vega 5 specification.
This world population report combines a projected map, proportional bubbles, growth-rate patterns and a ranked table into one portrait-format Vega graphic. The complete Vega 5 specification is available below. It uses example values supplied with the design; verify and replace them before publishing a new report.
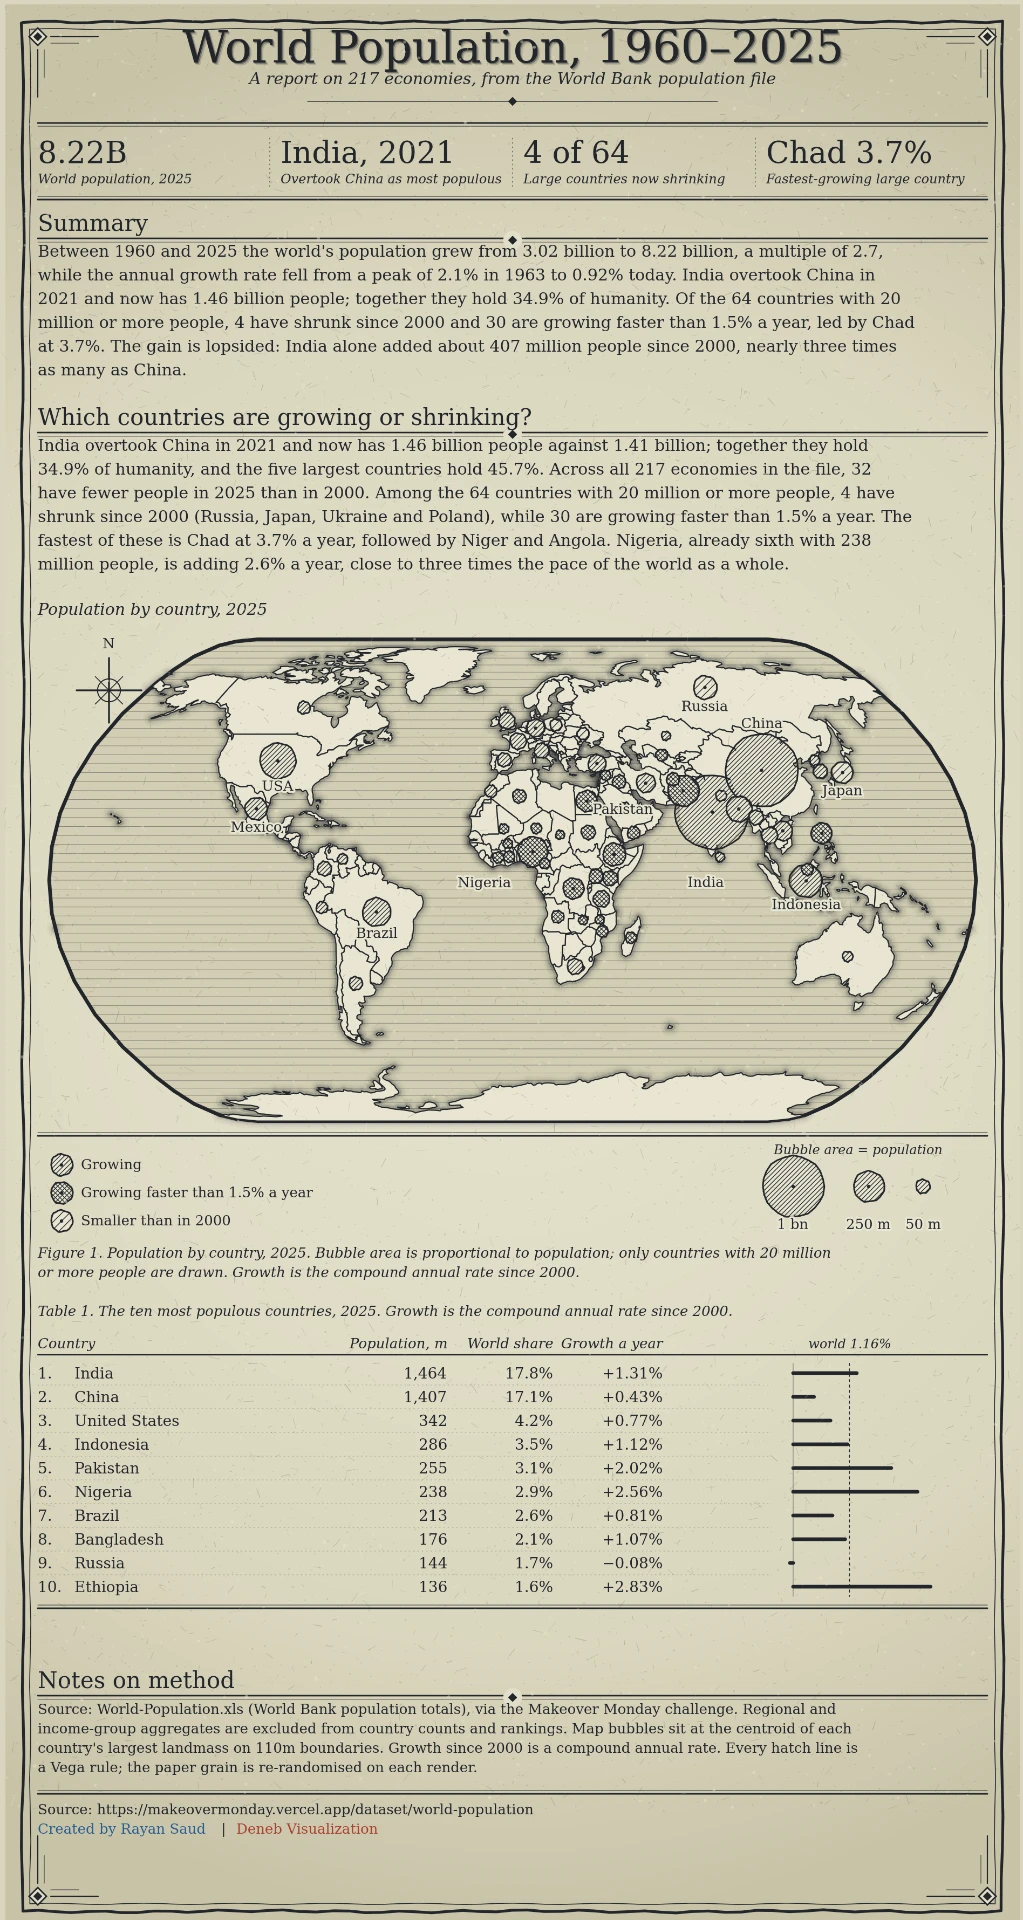
What the map shows
The central map places a bubble at each country's longitude and latitude. Bubble area represents population, while its hatch pattern indicates growth: ordinary growth, growth faster than 1.5% a year, or a smaller population in 2000. The surrounding report adds a headline, four summary figures, explanatory notes, a size key, a growth legend and a top-ten country table.
The supplied graphic labels 2025 population and growth figures for 64 large countries and includes a note describing a source workbook for 217 economies. The downloadable specification itself contains inline country values and prose; it does not fetch the population workbook automatically. Treat the narrative, rankings, world total and source note as dated example copy, not live figures.
Open the specification
- Download the JSON above. It is a Vega specification, not Vega-Lite.
- Open the Vega Editor, select Vega and paste the contents of the downloaded file into the specification pane.
- Allow the editor to load the external
world-110m.jsongeography file from the Vega datasets CDN. An internet connection is required for the land shapes. - Render or export the graphic. Its canvas is 880 × 1636 pixels; view it at full size for readable labels.
This original specification is designed for the Vega Editor. It is not a drop-in Power BI Deneb template: Deneb receives Power BI rows through its own dataset binding, while this file contains inline values and uses an external geography URL. To adapt it for Deneb, supply the country table and geography as appropriate datasets and rework the static report text.
Step 1: Define the projection and geography
The specification declares a naturalEarth1 projection named proj. The land data source loads Natural Earth country outlines from https://cdn.jsdelivr.net/npm/vega-datasets@2/data/world-110m.json using Vega's TopoJSON countries feature. The sphere data source draws the globe boundary. If the map outline is blank while the rest of the report renders, first check access to that external file.
To make a self-contained or offline variant, download the TopoJSON dataset separately and replace the land.url value with your own hosted path or an inline values dataset. The source data and map geometry are separate: changing the population values does not change country borders.
Step 2: Position the population bubbles
In data.bubbles.values, each object contains a country name, lon, lat, population in millions as m, an annual growth rate g, circle radius r, a pattern selector sp, and optional label positioning fields. A geopoint transform projects longitude and latitude into pixel coordinates px and py using the same proj as the land.
| Field | Example | Purpose |
|---|---|---|
name | India | Full country name in the inline dataset |
lon, lat | 79.54, 22.82 | Bubble location |
m | 1463.9 | Population in millions |
g | 1.31 | Annual growth percentage shown in the table |
r | 34.4 | Precomputed circle radius in pixels |
sp, cross | 3, 0 | Hatch spacing and pattern variant |
Do not update m alone. The circles use the precomputed r field; recompute radii in proportion to the square root of population so area, rather than diameter, represents the new values. The size legend in bkey must use the same scale. Update g, hatch choices, country labels and the table too.
Step 3: Arrange the report around the map
The datasets kpi, prose, heads and tbl carry the fixed summary cards, explanatory paragraphs, section headings and ten ranked rows. The map is one part of a composed page; editing bubbles does not recalculate the headline, paragraphs or table. Rewrite those datasets when changing the year, geography or population series. The decorative border, grain and engraving-style hatches are separate marks; you can simplify them without touching the underlying data.
Verify the figures before publishing
The supplied artwork cites a World Bank population file via a Makeover Monday dataset and includes growth calculations and explanatory claims. Confirm the underlying series, countries, year, units and growth formula against your chosen primary source. The visual's 2025 labels, ranks and year-specific narrative are snapshots. Do not describe a revised version as current unless you have checked every headline and table row. If you change to a different source, update the attribution in the graphic's notes as well.
Troubleshooting
- Blank map, visible text: the external TopoJSON geography did not load. Check the URL and your network or host the file yourself.
- Bubbles in the wrong ocean: check longitude before latitude, and use decimal degrees, not a country code or string.
- Bubble labels collide: adjust
dx,dyandalfor the affected country. The labels in this artwork were positioned for its current data. - The map and table disagree: their country values are stored in separate datasets. Update both, along with the KPI and prose datasets.
- The file fails in Vega-Lite or Deneb: choose pure Vega in the Vega Editor. Deneb requires a separate data-binding adaptation.
For another annotated Vega example, see the global oil timeline template. If you need a custom geographic report for your data, get in touch.