Revenue Performance Variance Visual: Power BI SVG Template
Build a professional slope chart visual in Power BI using DAX and SVG. Compare year-over-year performance with variance indicators and dynamic labels.
This template creates a stunning slope chart visual in Power BI using pure DAX and SVG. It compares revenue performance between two years with dynamic labels, percentage change badges, and variance indicators. Perfect for executive dashboards and financial reports.
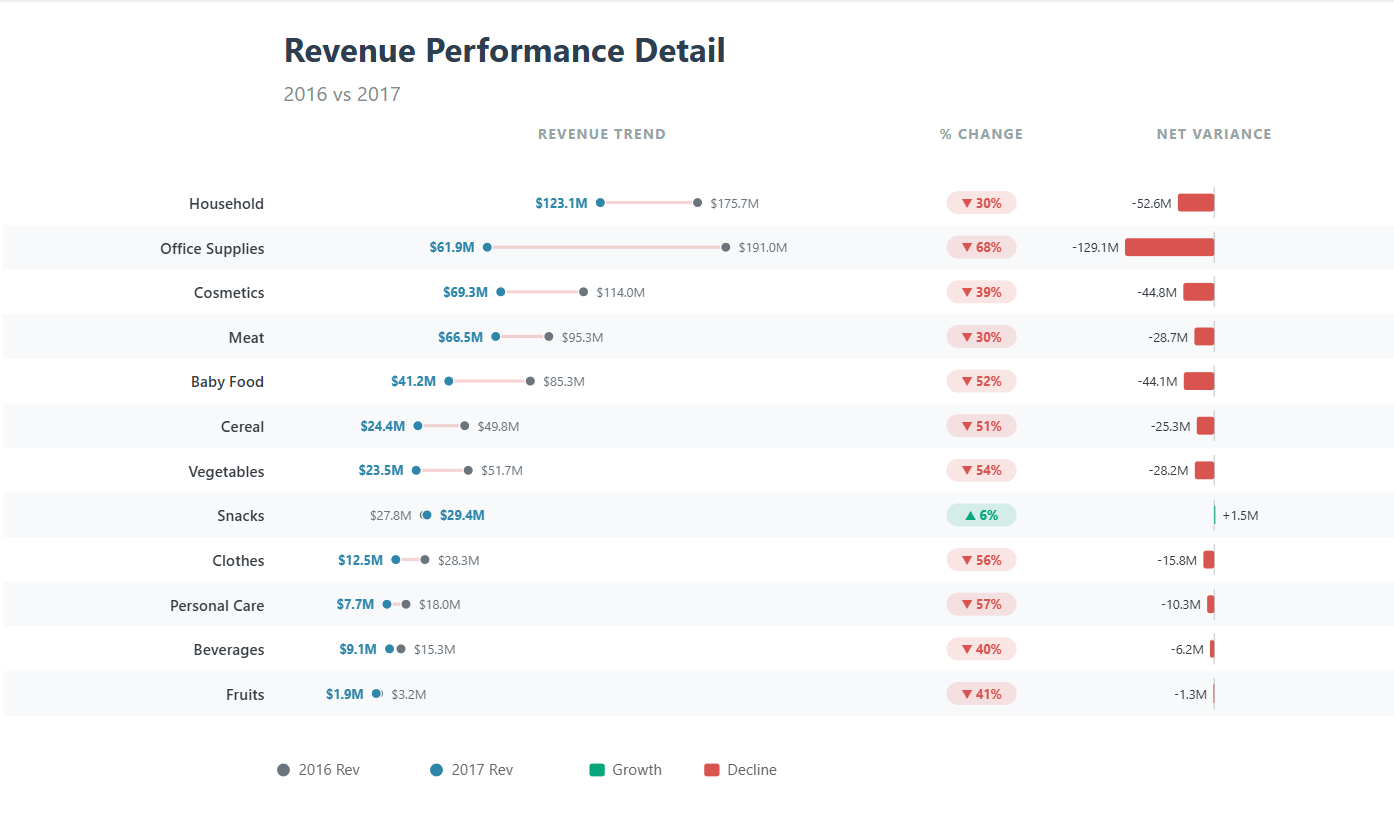
Example output showing revenue comparison with variance indicators
What This Visual Does
- Slope Chart: Compares two time periods visually with connecting lines
- Dynamic Labels: Revenue labels placed on either side of the endpoints; dense or tied values still need checking
- Percentage Change Badges: Color-coded badges showing growth or decline
- Variance Bars: Horizontal bars showing net variance with direction
- Top N Items: Automatically shows top 20 items by current year revenue
- Zebra Striping: Alternating row colors for better readability
Prepare the data and comparison first
You need a date column, a category such as product or region, and a numeric revenue column. The example uses the automatic year hierarchy on Order Date. If your model uses a proper calendar table instead, replace every hierarchy reference consistently; changing just one reference can produce different periods in the labels and calculations.
Confirm the definition of revenue before building the graphic: net or gross of returns, with or without tax, and in one reporting currency. Reconcile both years in a plain table first. For a current year that is still in progress, compare the same elapsed dates in the prior year rather than full-year prior revenue against partial-year current revenue.
This is a same-row two-period comparison with connected dots, rather than a classic slopegraph with categories ranked separately on two vertical axes. It works well for explaining which products gained or lost the most revenue. It is less suitable for showing a long trend, many overlapping categories or values that cross zero.
Complete DAX Code
Combine the code blocks below into one measure in the order shown; they are sections of the same expression, not separate measures. Replace 'Sales'[Item Type] and 'Sales'[Total Revenue] with your field names. Total Revenue here is a numeric column passed into SUM; if you already have a measure, replace each SUM expression with that measure rather than putting a measure inside SUM.
  SVG_Slope_Variance_Performance_v12 =
  -- =====================================================
  -- 1. DATA PREP
  -- =====================================================
  VAR CurrentYear = MAX('Sales'[Order Date].[Year])
  VAR PriorYear   = CurrentYear - 1

  VAR SummaryTable =
      TOPN(
          20,
          SUMMARIZE(
              ALLSELECTED('Sales'),
              'Sales'[Item Type]
          ),
          CALCULATE(SUM('Sales'[Total Revenue])),
          DESC
      )

  VAR MaxSalesRaw =
      MAXX(
          SummaryTable,
          MAX(
              CALCULATE(SUM('Sales'[Total Revenue]), 'Sales'[Order Date].[Year] = PriorYear),
              CALCULATE(SUM('Sales'[Total Revenue]), 'Sales'[Order Date].[Year] = CurrentYear)
          )
      )

  VAR MaxSales = MaxSalesRaw * 1.3

  VAR MaxAbsDiff =
      MAXX(
          SummaryTable,
          ABS(
              CALCULATE(SUM('Sales'[Total Revenue]), 'Sales'[Order Date].[Year] = CurrentYear)
              - CALCULATE(SUM('Sales'[Total Revenue]), 'Sales'[Order Date].[Year] = PriorYear)
          )
      )

  -- =====================================================
  -- 2. COLORS & LAYOUT
  -- =====================================================
  VAR ColorLastYear = "#6c757d"
  VAR ColorCurrYear = "#2E86AB"
  VAR ColorGrowth   = "#06A77D"
  VAR ColorDecline  = "#D9534F"
  VAR TextColor     = "#343a40"
  VAR ZebraColor    = "#f8f9fa"

  VAR MarginLeft     = 220
  VAR BadgeArea      = 80
  VAR DiffChartWidth = 220
  VAR RowHeight      = 35
  VAR TopPadding     = 120

  VAR BadgeX    = MarginLeft + 520
  VAR VarianceX = BadgeX + BadgeArea + 20
  VAR ZeroAxisX = VarianceX + (DiffChartWidth / 2)

  VAR SlopeStartX = MarginLeft + 70
  VAR SlopeEndX   = BadgeX - 90
  VAR SlopeWidth  = SlopeEndX - SlopeStartX

  VAR Width  = ZeroAxisX + (DiffChartWidth / 2) + 100
  VAR Height = TopPadding + (COUNTROWS(SummaryTable) * RowHeight) + 100
Step 3: Row Generation Section
  -- =====================================================
  -- 4. ROWS
  -- =====================================================
  VAR ChartRows =
      CONCATENATEX(
          SummaryTable,

          VAR S_Prior = CALCULATE(SUM('Sales'[Total Revenue]), 'Sales'[Order Date].[Year] = PriorYear)
          VAR S_Curr  = CALCULATE(SUM('Sales'[Total Revenue]), 'Sales'[Order Date].[Year] = CurrentYear)

          VAR SalesDiff = S_Curr - S_Prior
          VAR PctChange = DIVIDE(SalesDiff, S_Prior, 0)
          VAR Symbol    = IF(SalesDiff > 0, "▲", IF(SalesDiff < 0, "▼", "•"))

          VAR RowRank = RANKX(SummaryTable, CALCULATE(SUM('Sales'[Total Revenue])), , DESC)
          VAR Y = TopPadding + (RowRank * RowHeight)

          VAR X1 = SlopeStartX + DIVIDE(S_Prior, MaxSales) * SlopeWidth
          VAR X2 = SlopeStartX + DIVIDE(S_Curr, MaxSales) * SlopeWidth

          VAR DiffColor = IF(SalesDiff >= 0, ColorGrowth, ColorDecline)

          -- Dynamic Label Positioning
          VAR L1_X = IF(S_Prior < S_Curr, X1 - 10, X1 + 10)
          VAR L1_Anchor = IF(S_Prior < S_Curr, "end", "start")

          VAR L2_X = IF(S_Curr < S_Prior, X2 - 10, X2 + 10)
          VAR L2_Anchor = IF(S_Curr < S_Prior, "end", "start")

          -- Variance Bars
          VAR BarMaxWidth = (DiffChartWidth / 2) - 40
          VAR BarWidth = DIVIDE(ABS(SalesDiff), MaxAbsDiff) * BarMaxWidth
          VAR BarX = IF(SalesDiff >= 0, ZeroAxisX, ZeroAxisX - BarWidth)

          RETURN
              IF(MOD(RowRank, 2) = 0, "<rect x='0' y='" & Y - (RowHeight / 2) & "' width='" & Width & "' height='" & RowHeight & "' fill='" & ZebraColor & "' />", "") &
              "<g>" &

              -- ITEM LABEL
              "<text x='" & MarginLeft - 15 & "' y='" & Y + 5 & "' text-anchor='end' style='font-family:Segoe UI Semibold;font-size:12px;fill:" & TextColor & ";' >" & [Item Type] & "</text>" &

              -- SLOPE LINE
              "<line x1='" & X1 & "' y1='" & Y & "' x2='" & X2 & "' y2='" & Y & "' stroke='" & DiffColor & "' stroke-width='2.5' opacity='0.25' />" &

              -- DOTS
              "<circle cx='" & X1 & "' cy='" & Y & "' r='4' fill='" & ColorLastYear & "' stroke='white' stroke-width='1' />" &
              "<circle cx='" & X2 & "' cy='" & Y & "' r='4' fill='" & ColorCurrYear & "' stroke='white' stroke-width='1' />" &

              -- DIRECTIONAL LABELS
              "<text x='" & L1_X & "' y='" & Y + 4 & "' text-anchor='" & L1_Anchor & "' style='font-family:Segoe UI;font-size:10px;fill:" & ColorLastYear & ";' >" &
                  "quot; & FORMAT(S_Prior / 1000000, "#,0.0") & "M</text>" &

              "<text x='" & L2_X & "' y='" & Y + 4 & "' text-anchor='" & L2_Anchor & "' style='font-family:Segoe UI;font-size:10px;font-weight:bold;fill:" & ColorCurrYear & ";' >" &
                  "quot; & FORMAT(S_Curr / 1000000, "#,0.0") & "M</text>" &

              -- % CHANGE BADGE
              "<rect x='" & BadgeX & "' y='" & Y - 9 & "' width='55' height='18' rx='9' fill='" & DiffColor & "' opacity='0.15' />" &
              "<text x='" & BadgeX + 27.5 & "' y='" & Y + 4 & "' text-anchor='middle' style='font-family:Segoe UI;font-size:10px;font-weight:bold;fill:" & DiffColor & ";' >" & Symbol & " " & FORMAT(ABS(PctChange), "0%") & "</text>" &

              -- VARIANCE BARS & LABELS
              "<line x1='" & ZeroAxisX & "' y1='" & Y - 12 & "' x2='" & ZeroAxisX & "' y2='" & Y + 12 & "' stroke='#ccc' stroke-width='1' />" &
              "<rect x='" & BarX & "' y='" & Y - 7 & "' width='" & BarWidth & "' height='14' rx='2' fill='" & DiffColor & "' />" &
              "<text x='" & IF(SalesDiff >= 0, BarX + BarWidth + 5, BarX - 5) & "' y='" & Y + 4 &
                  "' text-anchor='" & IF(SalesDiff >= 0, "start", "end") &
                  "' style='font-family:Segoe UI;font-size:10px;fill:" & TextColor & ";' >" &
                  IF(SalesDiff > 0, "+", "") & FORMAT(SalesDiff / 1000000, "#,0.0") & "M</text>" &

              "</g>",
          ""
      )
Step 4: Legend and SVG Assembly
  -- =====================================================
  -- 5. LEGEND & SVG FINAL
  -- =====================================================
  VAR LegendY = Height - 40
  VAR Legend =
      "<g transform='translate(" & MarginLeft & "," & LegendY & ")'>" &
      "<circle cx='0' cy='0' r='5' fill='" & ColorLastYear & "' /> <text x='12' y='4' style='font-family:Segoe UI;font-size:12px;fill:#666;' >" & PriorYear & " Rev</text>" &
      "<circle cx='120' cy='0' r='5' fill='" & ColorCurrYear & "' /> <text x='132' y='4' style='font-family:Segoe UI;font-size:12px;fill:#666;' >" & CurrentYear & " Rev</text>" &
      "<rect x='240' y='-5' width='12' height='10' fill='" & ColorGrowth & "' rx='2' /> <text x='258' y='4' style='font-family:Segoe UI;font-size:12px;fill:#666;' >Growth</text>" &
      "<rect x='330' y='-5' width='12' height='10' fill='" & ColorDecline & "' rx='2' /> <text x='348' y='4' style='font-family:Segoe UI;font-size:12px;fill:#666;' >Decline</text>" &
      "</g>"

  RETURN
  "<svg viewBox='0 0 " & Width & " " & Height & "' xmlns='http://www.w3.org/2000/svg' fill='white'>" &
  "<rect width='100%' height='100%' fill='white' />" &
  "<text x='" & MarginLeft & "' y='45' style='font-family:Segoe UI;font-size:26px;font-weight:bold;fill:#2C3E50;' >Revenue Performance Detail</text>" &
  "<text x='" & MarginLeft & "' y='75' style='font-family:Segoe UI;font-size:16px;fill:#7f8c8d;' >" & PriorYear & " vs " & CurrentYear & "</text>" &

  -- Headers
  "<text x='" & (SlopeStartX + SlopeWidth / 2) & "' y='105' text-anchor='middle' style='font-family:Segoe UI;font-size:11px;font-weight:bold;fill:#95a5a6;letter-spacing:1px;' >REVENUE TREND</text>" &
  "<text x='" & BadgeX + 27.5 & "' y='105' text-anchor='middle' style='font-family:Segoe UI;font-size:11px;font-weight:bold;fill:#95a5a6;letter-spacing:1px;' >% CHANGE</text>" &
  "<text x='" & ZeroAxisX & "' y='105' text-anchor='middle' style='font-family:Segoe UI;font-size:11px;font-weight:bold;fill:#95a5a6;letter-spacing:1px;' >NET VARIANCE</text>" &

  ChartRows &
  Legend &
  "</svg>"
How to Customize This Template
1\. Change Field Names
Replace these references with your actual field names:
'Sales'[Item Type]→ Your category field (e.g., Product, Region, Department)'Sales'[Total Revenue]→ Your measure (e.g., Sales Amount, Profit)'Sales'[Order Date]→ Your date field
2\. Adjust Number Formatting
The template currently formats values as millions. To change this, modify these lines:
  -- For thousands:
  FORMAT(S_Prior / 1000, "#,0.0") & "K"

  -- For exact values:
  FORMAT(S_Prior, "#,0")

  -- For billions:
  FORMAT(S_Prior / 1000000000, "#,0.00") & "B"
3\. Change Colors
Modify these color variables to match your branding:
  VAR ColorLastYear = "#6c757d"  -- Gray for prior year
  VAR ColorCurrYear = "#2E86AB"  -- Blue for current year
  VAR ColorGrowth   = "#06A77D"  -- Green for positive change
  VAR ColorDecline  = "#D9534F"  -- Red for negative change
4\. Change Top N Value
To show more or fewer items, change this line:
  VAR SummaryTable =
      TOPN(
          20,  -- Change this number (e.g., 10, 50)
          SUMMARIZE(...)
How to Add to Your Report
- Create the Measure: Right-click on a table in your model → New Measure → Paste the code
- Add to Report: Insert a Table or Matrix visual
- Return an image URI: The example assembles raw SVG. For native image rendering, prefix the returned string with
data:image/svg+xml;utf8,and encode reserved URI characters, including replacing colour-code#characters with%23. Escape XML-sensitive characters in category labels before concatenating them. - Categorise as an image: Set the measure's Data category to Image URL, add it to a supported table or matrix, then adjust the image dimensions. Raw SVG text alone will not become an image just by resizing the visual.
- Resize: Adjust visual size to see the full chart properly
How It Works
This visual uses Power BI's ability to render SVG (Scalable Vector Graphics) within a measure. Here's what's happening:
- DAX Variables: Calculate current and prior year values, max values for scaling, and positions
- CONCATENATEX: Loops through each item, building SVG elements for each row
- SVG Elements: Creates circles (dots), lines (slope), text (labels), and rectangles (badges/bars)
- Dynamic Positioning: Labels automatically move based on whether values increased or decreased
- Color Coding: Green for growth, red for decline
Troubleshooting
| Problem | Solution |
|---|---|
| Visual shows blank | Check that your date field has year hierarchy enabled. Ensure there are at least 2 years of data. |
| Labels overlap | Increase SlopeWidth variable or reduce font sizes |
| Visual is cut off | Make the visual larger on the canvas or reduce RowHeight |
| Values show wrong year | Check date field has proper year values and hierarchy |
Advanced Customizations
Validate the numbers before trusting the picture
Test a category with $1,000,000 prior revenue and $1,200,000 current revenue. Its net variance should be +$200,000 and its percentage change +20%. Test a decline, an unchanged item and an item with no prior revenue as well. A missing or zero prior value should read as a new item or an unavailable percentage, not automatically as 0% growth; the example's DIVIDE fallback needs adapting for that distinction.
Check ties in the ranking. Equal revenue can give rows the same RANKX result and therefore the same vertical position. For production use, use a deterministic category tie-breaker or assign unique row positions before rendering. TOPN can also return more than the requested count when the boundary is tied.
Click each report slicer and compare the output with a plain table. The category list follows ALLSELECTED, but the comparison dates and ranking need to match the business question. If a product disappears because it has no current revenue, explicitly decide whether the top-N rule should retain it based on prior revenue or absolute loss instead.
The growth/decline example below is a measure, not a field that can be placed directly in a slicer. Use it as a visual-level filter where supported, or build a disconnected selector and filtering logic. Likewise, a separate tooltip measure does not make individual SVG dots interactive: an SVG rendered as an image is one image cell.
For costs, positive variance is not necessarily favourable. Rename the legend and reverse the favourable/unfavourable colour logic when adapting this to expense reporting. Pair colours with signs and exact values so the meaning survives monochrome printing and colour-vision differences.
Related implementation guides
Use Deneb and Vega when you need mark-level interaction, and review Power BI data modelling before embedding reporting logic in a visual. For a tailored comparison with your fiscal calendar and measures, see Power BI consulting.
Add Tooltips
Create a separate measure that returns text with additional context:
  Tooltip Measure =
  VAR Item = SELECTEDVALUE('Sales'[Item Type])
  VAR Curr = CALCULATE(SUM('Sales'[Total Revenue]), 'Sales'[Order Date].[Year] = 2024)
  VAR Prior = CALCULATE(SUM('Sales'[Total Revenue]), 'Sales'[Order Date].[Year] = 2023)
  VAR Diff = Curr - Prior
  VAR Pct = DIVIDE(Diff, Prior, 0)
  RETURN
      Item & " Revenue:" &
      UNICHAR(10) & "2024: " & FORMAT(Curr, "$#,##0") &
      UNICHAR(10) & "2023: " & FORMAT(Prior, "$#,##0") &
      UNICHAR(10) & "Change: " & FORMAT(Pct, "0%")
Filter by Growth/Decline
Add a slicer that filters items by growth direction:
  Growth Flag =
  VAR Curr = CALCULATE(SUM('Sales'[Total Revenue]), 'Sales'[Order Date].[Year] = 2024)
  VAR Prior = CALCULATE(SUM('Sales'[Total Revenue]), 'Sales'[Order Date].[Year] = 2023)
  RETURN
      IF(Curr > Prior, "Growth", "Decline")
Best Practices
- Use with Filter Context: Add year slicers to let users select comparison years
- Combine with Other Visuals: Pair with a table showing exact values for reference
- Responsive Sizing: Use the "Fit" image size option for best results
- Mobile Considerations: This visual works best on desktop; consider alternative for mobile
- Performance: Limit to top 20-30 items for optimal rendering speed
Next Steps
Now that you have this template working:
- Experiment with different color schemes to match your report theme
- Try adjusting the layout variables to create different visual styles
- Combine with bookmarks for interactive "what-if" scenarios
- Export as a template to reuse across multiple reports
This template demonstrates the power of combining DAX calculations with SVG graphics. With some practice, you can create virtually any custom visualization imaginable within Power BI.