Free SaaS Financial Model Template: 5-Year Excel Forecast
Download a free investor-ready SaaS financial model with 60-month projections, integrated financial statements, unit economics, scenarios and an executive dashboard.
This free Excel template turns operating assumptions into a five-year monthly SaaS forecast. It connects customer acquisition, recurring revenue, staffing, operating costs and capital requirements to an integrated profit and loss statement, balance sheet and cash flow statement.
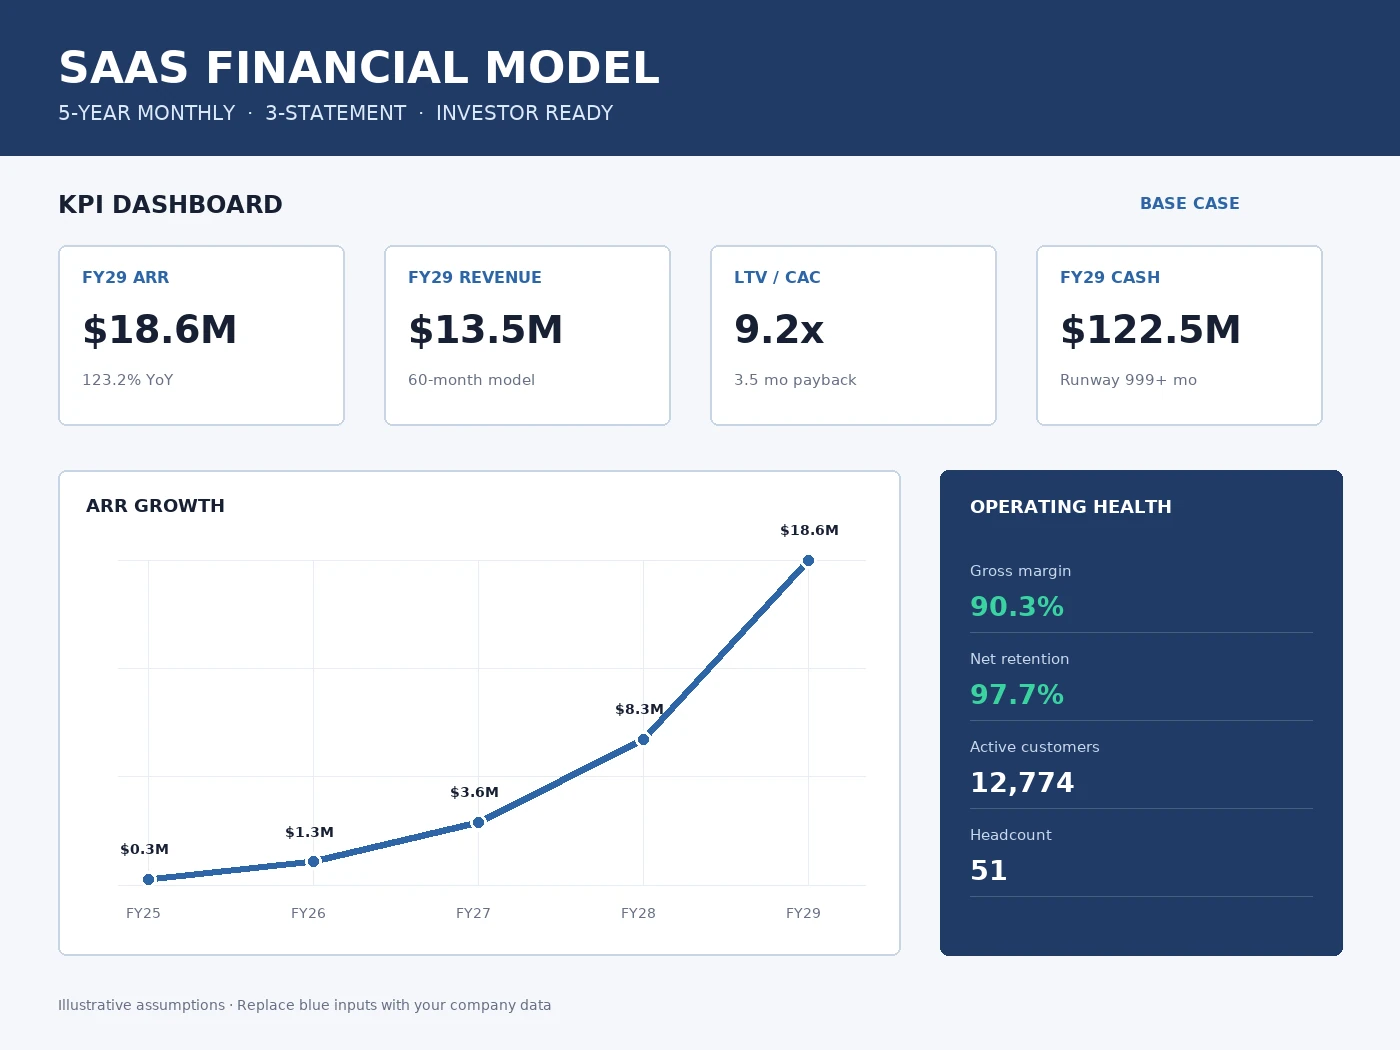
The executive dashboard summarizes growth, profitability, unit economics and cash runway.
Who this model is for
The workbook is designed for SaaS founders, finance teams and advisers preparing a budget, testing a fundraising plan or explaining the path from customer growth to cash runway. It is detailed enough for an investor conversation while keeping editable inputs on one clearly marked assumptions sheet.
What is included
| Section | What it models |
|---|---|
| Assumptions | Market size, pricing, churn, conversion, costs, hiring and financing inputs. |
| Revenue & funnel | Monthly MRR and ARR built from leads, conversions, customer movements and pricing. |
| Cohorts | Annual customer retention and revenue development by acquisition cohort. |
| Costs & hiring | COGS, department-level operating expenses and a role-by-role payroll plan. |
| Capital | Funding rounds, dilution and the effect of new capital on runway. |
| Unit economics | CAC, LTV, payback period and contribution margin. |
| Financial statements | An integrated P&L, balance sheet and indirect cash flow statement. |
| Decision support | Conservative, base and aggressive scenarios, sensitivity tables and a KPI dashboard. |
How to use it
- Save a working copy. Keep the original download untouched so you always have a clean baseline.
- Start on Assumptions. Replace the blue input cells with your pricing, churn, conversion, staffing and cost assumptions. Avoid typing over formulas.
- Review the operating schedules. Check Revenue, Funnel, COGS, Hiring and OpEx before relying on the financial statements.
- Test scenarios. Compare conservative, base and aggressive cases, then use the sensitivity tables to identify the inputs with the greatest impact.
- Read the three statements together. Profit does not equal cash. Confirm that working capital, fundraising and hiring timing flow through the balance sheet and cash flow.
- Use the dashboard last. Present outputs only after the underlying schedules reconcile and the assumptions are supportable.
Model structure
The workbook contains 16 sheets: Cover, Assumptions, Revenue, Funnel, Cohorts, COGS, Hiring, OpEx, Capital, UnitEcon, P&L, BalSheet, CashFlow, Scenarios, Sensitivity and Dashboard. The forecast runs monthly for 60 months, with annual summaries where they improve readability.
Prepare your starting data before editing assumptions
Collect the most recent management accounts, bank balance, customer count, recurring subscription revenue, headcount and outstanding receivables and payables. Use a single cut-off date so the opening balance sheet and operating schedules describe the same business. An early-stage company without historical data can still model scenarios, but should label its assumptions as hypotheses rather than demonstrated performance.
Decide what a customer means: one company account, one paid user or one subscription. Mixing those units makes conversion rates and revenue per customer meaningless. Separate subscription revenue from implementation fees and other one-off services; do not annualise one-off work into ARR.
For annual contracts paid upfront, distinguish billing, revenue recognition and cash collection. Receiving $12,000 now does not automatically mean recognising $12,000 of subscription revenue this month. Check that the model's treatment matches your contract terms and accounting policy before using the statements for external reporting.
A worked MRR bridge
Monthly recurring revenue should reconcile from one month to the next. A useful bridge is opening MRR + new MRR + expansion − contraction − churned MRR. Here is an illustrative example, not a forecast for your company.
| MRR movement | Amount |
|---|---|
| Opening MRR | $40,000 |
| New customers | $6,000 |
| Expansion from existing customers | $2,000 |
| Contraction from existing customers | ($1,000) |
| Churned subscriptions | ($3,000) |
| Closing MRR | $44,000 |
Closing ARR on a simple MRR × 12 basis is $528,000, not the revenue earned over the previous twelve months. In this example, net revenue retention for the opening customer base is ($40,000 + $2,000 − $1,000 − $3,000) / $40,000 = 95%. New-customer revenue is excluded from that retention calculation.
Use this bridge as an independent check on the Revenue and Cohorts schedules. If expansion is not represented separately in your working version, do not quietly assume it is included in new customers. Document the simplification or adapt the schedule.
Interpret unit economics without false precision
Customer acquisition cost (CAC) divides the acquisition spend attributed to a period or cohort by customers acquired. Include the relevant sales and marketing payroll, not just advertising. Where the sales cycle is long, align spend and acquisitions rather than dividing this month's spending by unrelated customer wins.
CAC payback compares acquisition cost with monthly gross profit from the acquired customer. For example, $1,200 CAC and $200 monthly subscription revenue at 80% gross margin produce $160 monthly gross profit and a simple 7.5-month payback. This simplified measure does not incorporate ramp-up, expansion or changing service costs.
Lifetime value (LTV) is particularly sensitive to churn assumptions. The familiar revenue-per-customer × gross-margin ÷ monthly-churn shortcut assumes stable behaviour; tiny churn changes can create enormous apparent values. At zero churn, that shortcut is undefined, not evidence of infinite customer value. For young companies, measured cohort retention and cash payback are often more defensible than a long extrapolated lifetime.
Build scenarios around business drivers
A useful downside case changes the drivers that could actually disappoint, rather than cutting every revenue line by an arbitrary percentage. Consider lower lead volume, weaker conversion, a longer sales cycle, higher churn, discounting, delayed hiring adjustments and a later funding close.
| Driver | Question to test |
|---|---|
| Acquisition | What happens if customer wins arrive a month later? |
| Retention | How much cash headroom disappears if churn rises? |
| Hiring | Which start dates are committed and which are optional? |
| Collections | Does annual prepayment or slow payment change cash timing? |
| Funding | Can the business operate if the round closes three months late? |
Keep the assumptions internally consistent. A smaller sales team should not automatically deliver the same pipeline as the base case, and lower customer growth does not necessarily reduce committed payroll immediately. Record the rationale beside each scenario in your working notes.
Read runway from monthly cash, not just average burn
Opening cash divided by average monthly cash burn is a quick estimate, but it hides hiring steps, annual bills and financing dates. Use the monthly CashFlow schedule to find the first period when cash falls below the operating buffer you need. Then inspect the assumptions responsible for that shortfall.
Uncommitted fundraising is not guaranteed cash. Present a case without the round as well as the planned-funding case, and distinguish the date cash is needed from the date a fundraising process starts. For payment-level decisions over the next quarter, pair this longer-range model with the 13-week cash flow forecast.
Frequently asked questions
Can I use this for a pre-revenue startup?
Yes, as an assumption-led planning exercise. Put particular attention on hiring, product costs and funding needs, and label acquisition and retention assumptions as unvalidated until you have evidence.
Is ARR the same as cash in the bank?
No. ARR expresses recurring revenue at an annualised run rate. Collections depend on billing terms, payment timing and customer behaviour; cash also pays for costs and capital spending.
Is the sample model ready to send to investors unchanged?
No. Replace the illustrative inputs, reconcile the opening balances, check formulas and explain your scenarios. A polished dashboard is not a substitute for supportable assumptions or a review of the underlying statements.
Checks to complete before sharing
- Confirm the opening cash balance and fundraising dates match your actual plan.
- Reconcile customer additions, churn and ending customers from month to month.
- Compare gross margin, CAC payback and retention assumptions with credible benchmarks and your own history.
- Verify the balance sheet balances and ending cash agrees to the cash flow statement.
- Stress-test slower acquisition, higher churn and delayed funding rather than presenting only the base case.
Important limitations
This is a planning template, not investment, tax or accounting advice. Its sample assumptions are illustrative and must be replaced. Accounting policies, tax rules, revenue recognition and fundraising terms vary by company and jurisdiction, so have the finished model reviewed before using it for formal decisions.
Need the model adapted?
If your business has usage-based pricing, multiple currencies, complex revenue recognition or a different fundraising structure, request a custom financial model built around your operating data.